What Is a Bar Graph and When Should You Use It?

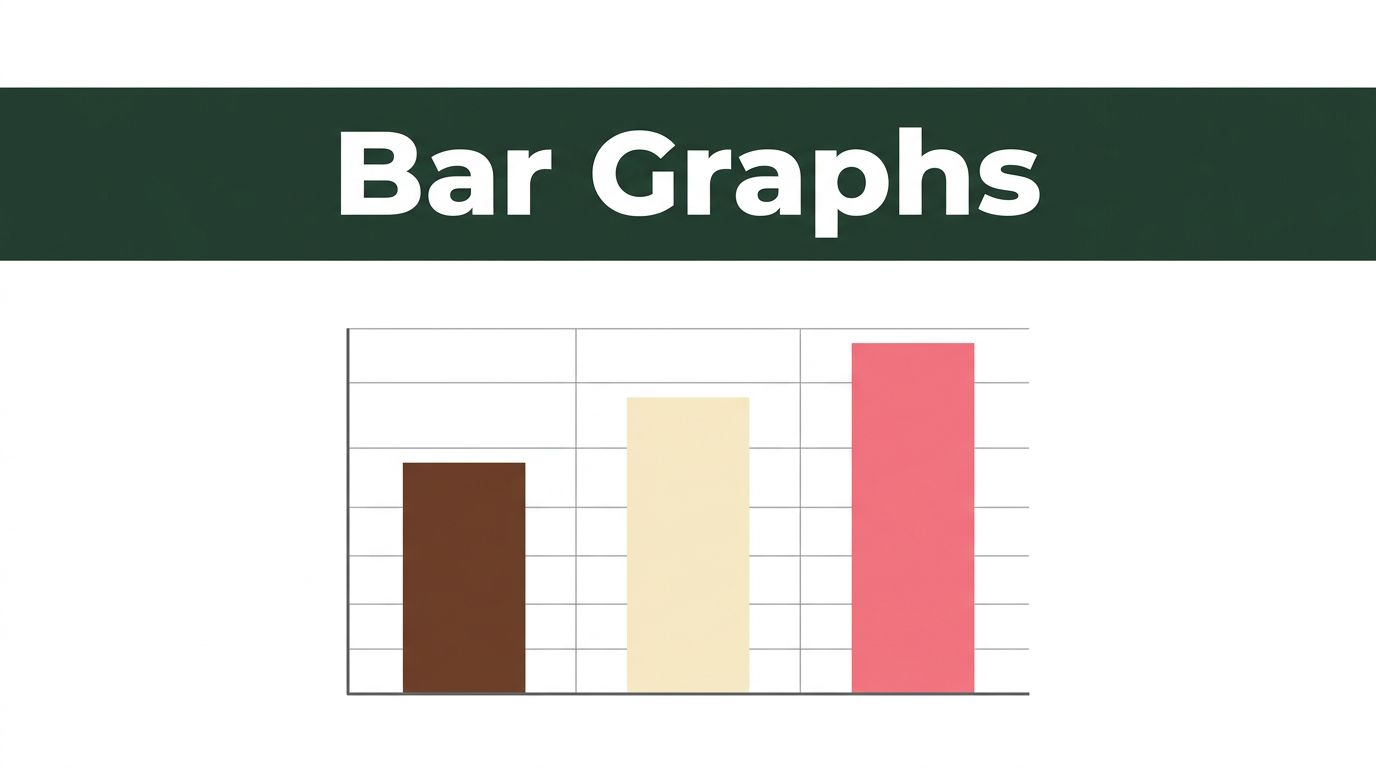
Picture your local ice cream shop at the end of summer. Chocolate scoops fly out the door. Vanilla sells steady. Strawberry lags behind. A quick bar graph reveals the winner: tall bar for chocolate, medium for vanilla, short for strawberry. These charts use rectangular bars to compare categories. Bar height or length matches the value. … Read more

How to Read and Understand Line Graphs Effortlessly

You glance at your phone bill. Costs climb month after month. A line graph makes that rise crystal clear in seconds. These charts track changes over time, like temperatures swinging daily or sales spiking during holidays. People meet them everywhere: news reports, school tests, work dashboards. Line graphs shine because they connect dots into stories. … Read more