Think about your social media feed. It suggests friends you might know. Or picture your GPS app plotting the fastest way home through traffic. These tools rely on graphs without you noticing.
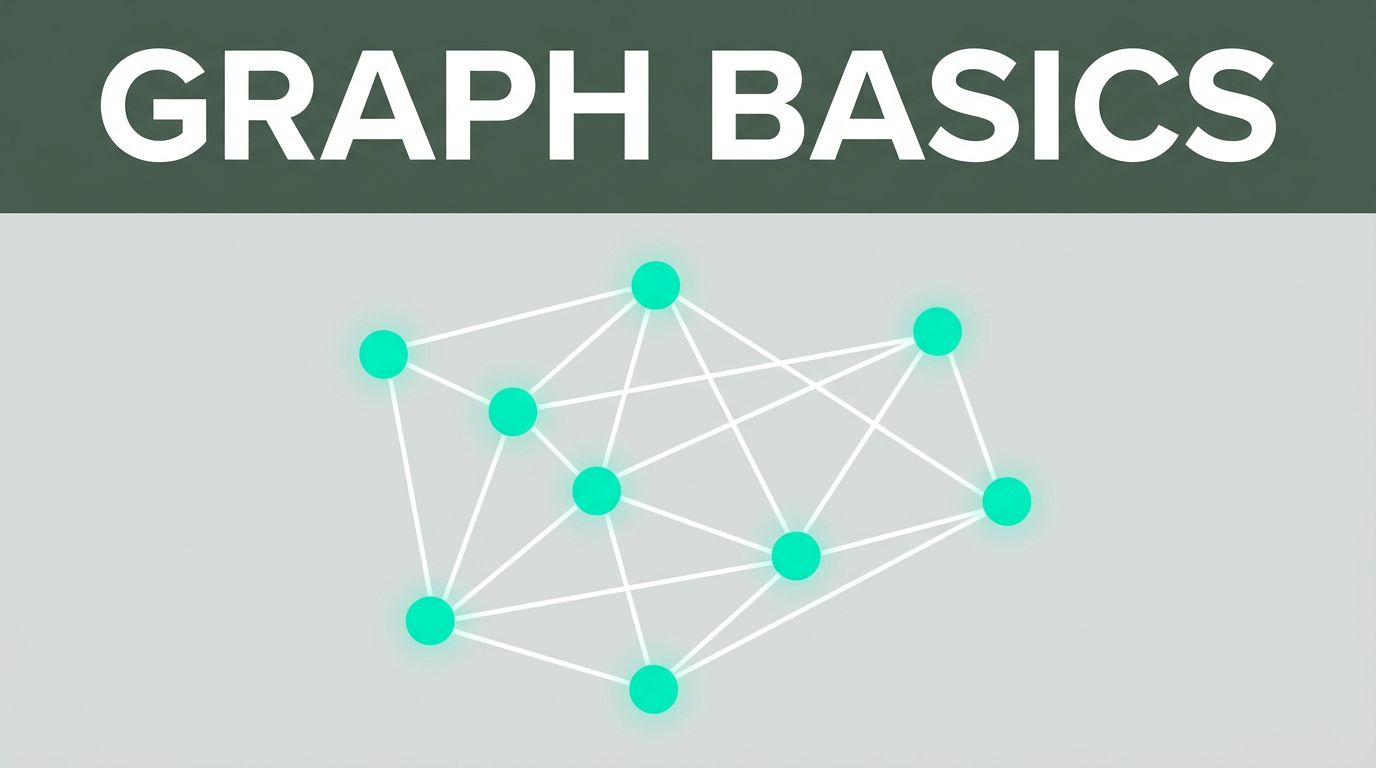
Graphs model connections in the world. They use dots called nodes for things like people or cities. Lines called edges link those nodes to show relationships such as friendships or roads. You see graphs everywhere in apps and AI. They beat simple lists by capturing how items relate.
This post breaks down graphs step by step. You’ll learn their parts, types, and real examples. Then see why they solve tough problems. Finally, peek at 2026 trends. Ready to spot graphs in your tech?
Breaking Down Graphs: The Key Pieces and Types
Graphs start simple. They hold nodes and edges. No strict order exists like in a list. Instead, focus falls on links between items. This setup fits messy real-world ties.
For a clear view, check this diagram of basic graph parts.
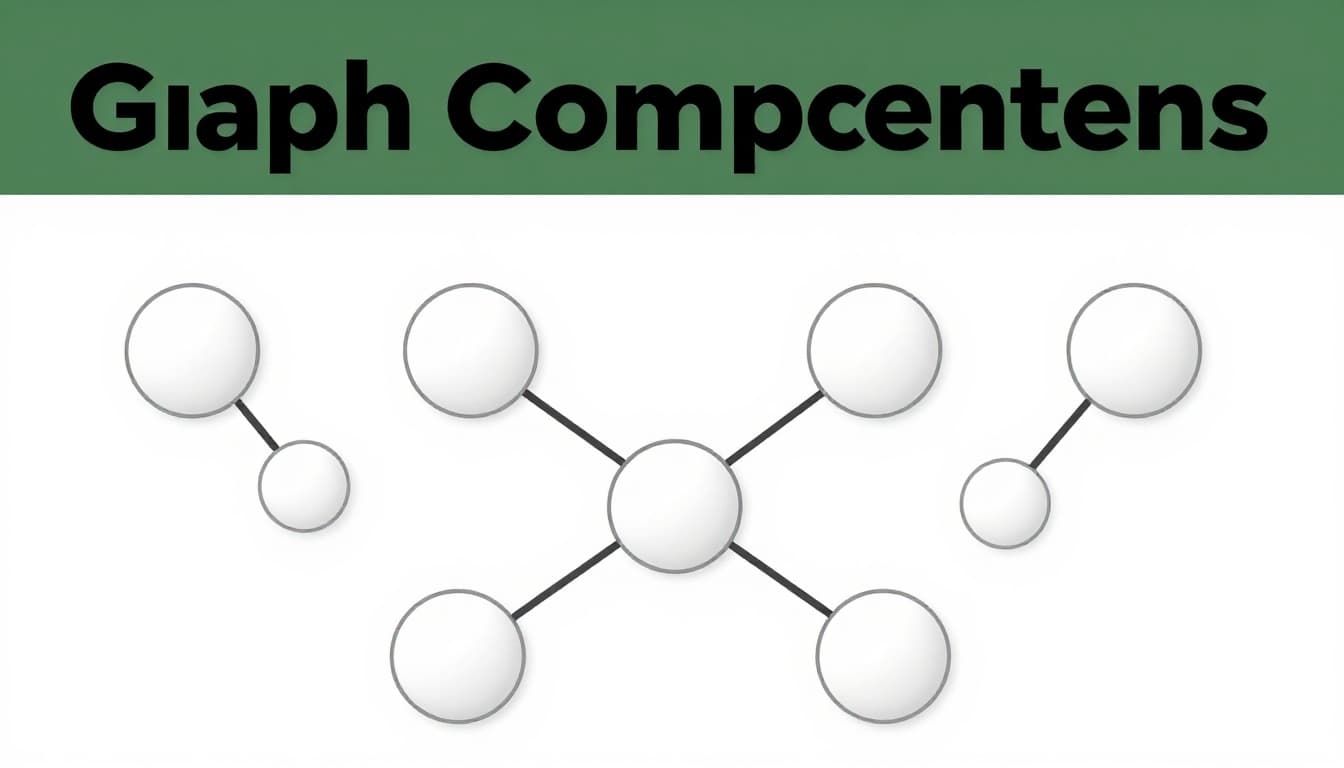
Nodes and Edges: The Heart of Every Graph
Nodes stand for objects. They could mean users in a network or stops on a trip. Edges join nodes. These lines carry meaning like “follows” or “connects to.”
Take web pages. Each page acts as a node. Hyperlinks serve as edges. Search engines crawl these paths to rank sites. Graphs shine here because they show influence flows naturally.
Nodes hold data too. Labels or properties add details. Edges might include direction or weight. This flexibility models life better than flat tables. In short, nodes and edges build the core.
Common Graph Types to Spot in Real Life
Graphs vary by rules. Each type suits certain problems. Here’s a quick look at key ones.
Undirected graphs have two-way edges. Friendships work this way. Both sides connect equally.
Directed graphs point one way. Think Twitter follows. You follow someone, but they don’t follow back.
Weighted graphs add numbers to edges. Road distances or flight costs fit here. Weights guide smart choices.
Unweighted graphs skip numbers. Simple yes/no links suffice.
Bipartite graphs split nodes into two groups. No edges link within groups. Job matches pair skills to roles.
Connected graphs let you reach any node from another. Islands break that rule.
Why care about types? They match problems. For example, delivery routes need weighted directed graphs. A gentle introduction to graph theory explains more on basics.
Each type appears daily. Spot them, and tech makes sense.
Graphs All Around You: Real-World Spotlights
Graphs hide in plain sight. They power networks you use now. Social apps suggest connections. Maps find paths. The web links pages.
These examples show graphs beat rows and columns. Tables list facts. Graphs reveal ties.
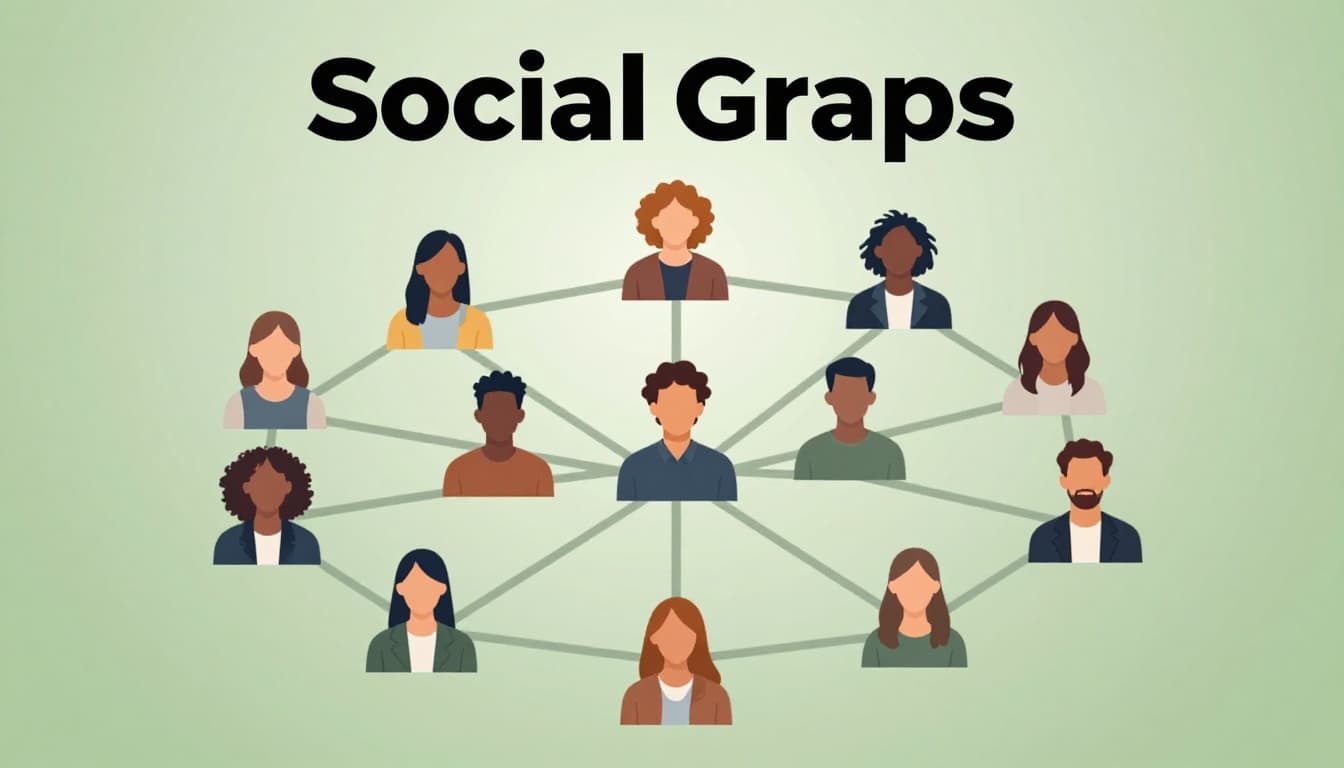
From Facebook Friends to Web Links
Social networks treat people as nodes. Friendships become edges. Apps predict ties by scanning paths. Short chains mean mutual friends.
Recommendation systems build on this. Netflix links users to shows via shared tastes. Graphs spot patterns fast. In 2026, interest graphs push content by likes, not just friends. A social recommendation system using heterogeneous graphs shows how.
Web links form graphs too. Pages connect via hyperlinks. Search ranks by importance through these ties.
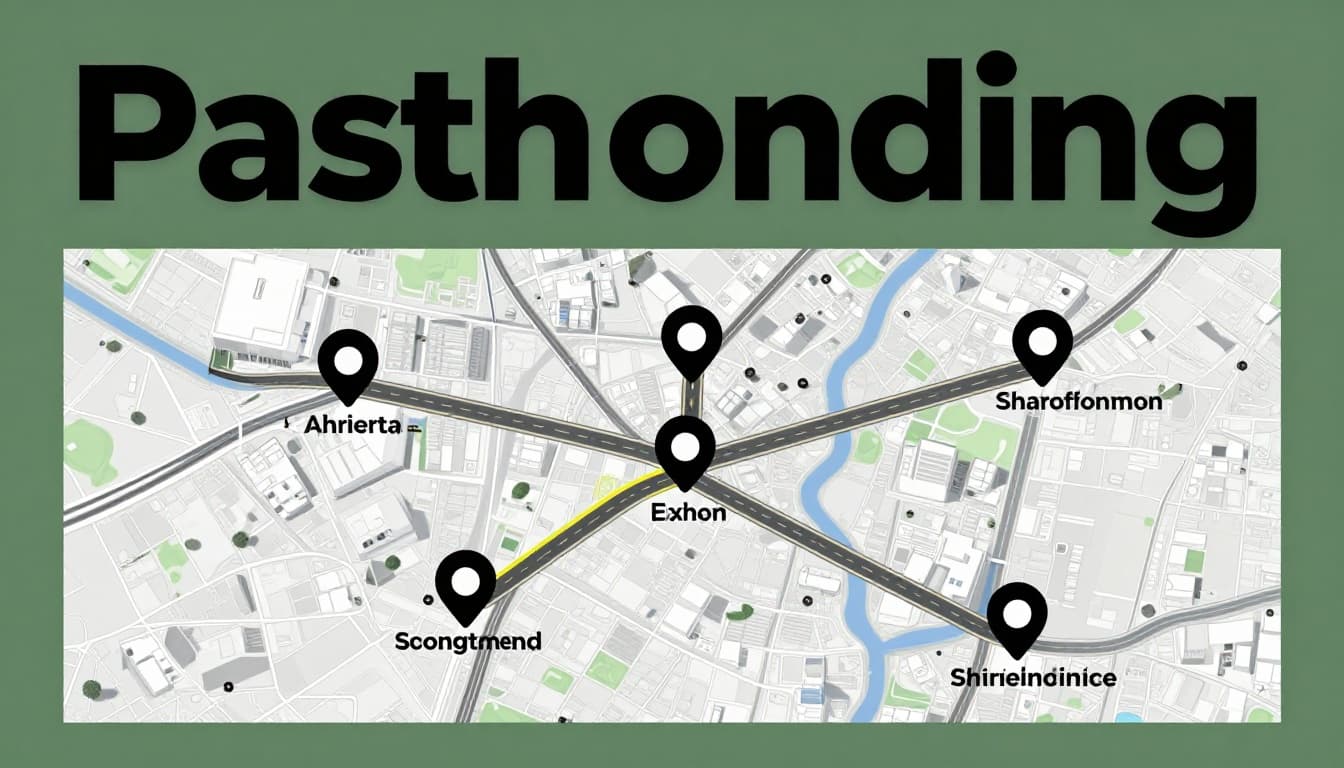
Navigating Roads and Data Flows
GPS apps model cities as nodes. Roads act as weighted edges. Traffic updates weights in real time.
Internet packets follow graph paths. Routers pick best routes. This keeps speeds high.
Google Maps uses graphs for directions. It factors turns and delays. Graphs handle changes better than lists.
Daily, you rely on these. Next time you navigate, thank graphs.
Why Graphs Change Everything: Power and Applications
Graphs solve connection puzzles. They find shortest paths or link cheaply. Algorithms turn data into action.
Efficiency stands out. Big networks process fast with right structures. Adjacency lists store neighbors neatly.
Smart Algorithms That Rely on Graphs
Dijkstra’s algorithm hunts shortest paths. It explores from start, picks lowest costs first. Delivery trucks save fuel this way.
Google Maps applies it daily. A piece on Dijkstra in Google Maps details real use.
Kruskal builds minimum spanning trees. It connects all with least total weight. Telecom wires or power grids benefit.
These tools optimize life. Graphs make them possible.
Fueling AI, Recommendations, and More
Graph databases query ties fast. Neo4j outperforms relational ones on connections. No slow joins needed.
Recommendations use graphs for “you might like.” Amazon traces purchase paths.
Social analysis spots trends. Graphs reveal clusters or influencers.
In all, graphs drive smart decisions.
Graphs in 2026: Hot Trends Shaping Tomorrow
Graphs evolve fast. Graph Neural Networks lead. GNNs learn from nodes and edges together.
Dynamic GNNs handle changing data. They spot fraud as transactions flow. Traffic predicts jams live.
Drug discovery maps proteins to diseases. GNNs find new meds quicker. Five GNN breakthroughs for 2026 highlights this.
GNNs pair with language models. They add structure to text reasoning.
Graph databases beat relational for networks. Queries run native on ties.
Quantum graphs emerge for huge scales. Social apps shift to interest graphs. GPS adapts to events instantly.
Trends point to more AI wins. Graphs fuel tomorrow’s tech.
Graphs connect dots in tech you love. From friend suggestions to quick routes, nodes and edges work quietly. Types and algorithms solve real issues. In 2026, GNNs push boundaries in AI and beyond.
Spot graphs next time you scroll or drive. Try Neo4j for hands-on fun. How will graphs change your world?