Skip to content

raroo

  • Home
  • About Us
  • DMCA
    • California Consumer Privacy Act (CCPA)
  • Cookie Privacy Policy
    • Privacy Policy
  • Terms of Use
  • Contact Us

Interpreting Data

How to Identify Trends in a Graph: Your Step-by-Step Guide

March 31, 2026 by admin

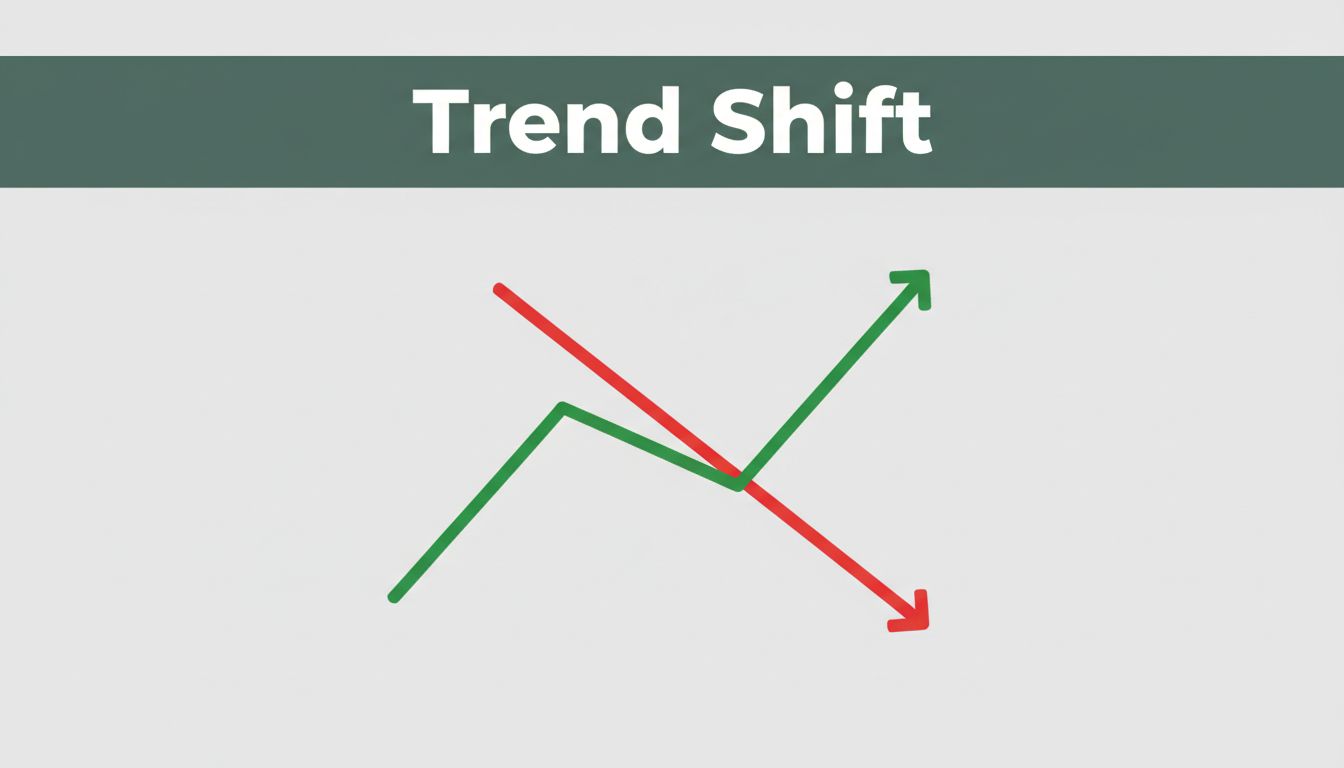
Imagine your coffee shop’s daily sales climbing steadily on a line chart as winter hits. Customers crave hot drinks, and the numbers prove it. You spot the trend right away: a clear upward pattern over weeks. Trends show patterns in data, like rises, falls, or steady holds over time. They guide smart choices in business, … Read more

Categories Interpreting Data Leave a comment

What Does an Increase or Decrease in a Graph Mean?

March 31, 2026 by admin

Picture this. You’re watching your favorite team’s score climb during a big game, or your portfolio dips as stocks tumble on the news. Graphs turn those raw numbers into quick visuals of change. An increase in a graph shows growth. Values rise from left to right or bar to bar. A decrease signals a drop. … Read more

Categories Interpreting Data Leave a comment

How to Compare Data Effectively with Charts

March 31, 2026 by admin

Picture this: Sarah stares at a spreadsheet packed with sales numbers from five regions. Her eyes glaze over after ten minutes. She switches to a simple bar chart, and boom, the top performer jumps out. Everyone in the meeting nods in agreement. Charts do that. They turn messy numbers into stories that stick. You spot … Read more

Categories Interpreting Data Leave a comment

What Are Outliers and How Do You Spot Them in Graphs?

March 31, 2026 by admin

Imagine a sales chart for your team. Most days cluster around 50 units sold. Then one bar shoots up to 500. Everyone notices. That spike grabs attention right away. Outliers are data points that stand far apart from the rest. They break the main pattern. Sometimes they come from errors, like a typing mistake. Other … Read more

Categories Interpreting Data Leave a comment

How to Avoid Misinterpreting Graph Data Like a Pro

March 31, 2026 by admin

Remember that viral chart from a 2025 news story? It showed a company’s sales jumping from 100 units to 105, but the y-axis started at 90. Everyone thought it was a massive boom. In reality, it was just a 5% bump. Graphs pop up everywhere now. You see them in news feeds, work reports, and … Read more

Categories Interpreting Data Leave a comment

Recent Posts

  • What Are Graphs? Nodes, Edges, and Why They Power Your Daily Tech
  • Common Mistakes Beginners Make Reading Graphs
  • How to Read Any Graph Step by Step
  • Graph Axes, Labels, and Legends Explained Simply
  • Graphs vs. Charts: Spot the Key Differences

Recent Comments

No comments to show.
  • Advanced Basics Made Simple
  • Creating Graphs
  • Graph Basics
  • Interpreting Data
  • Real-Life Applications
  • Types of Graphs
© 2026 raroo • Built with GeneratePress